
Click here to see the live tool.
Virtual Oscilloscope
Format
Data Visualization
Medium
D3.js, JavaScript, HTML, CSS
Back to Portfolio
Description
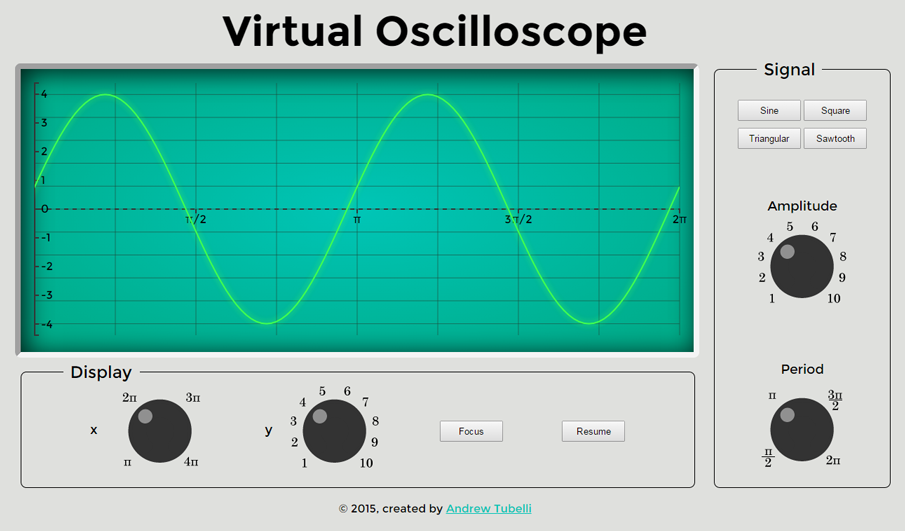
This is an engineering-related visualization. It is a simple virtual oscilloscope visualization that uses D3.js and JavaScript. An oscilloscope is a device that shows an electrical signal as a function of time. This is a very basic version of an oscilloscope that offers 4 types of waves: a sine wave, a square wave, a triangular wave, and a sawtooth wave. The x and y properties of both the signal and display properties can be changed.
The dials were created with jQuery-Knob.js.